Notes on User Interface
Main Header Bar

The Main Header Bar show the following information
- The IP Address and Name of the currently connected IntraVUE host.
- The WBC Network Health Monitor version number.
- The current dialog/panel/graph name.
- Real-time number of active Alarms and Warnings. This is updated several times a minute. Clicking on this section will bring up the Alarms and Warnings table with only the active alarms and warning shown. If an alarm is put in the sleep state, it will not count as active, it will be shown in the regular list of Alarms and Warnings where it's state can be changed.
Help Icon
![]() Almost every page has a Help Icon. When Clicked on the Help Icon will open the context sensitive help in this manual to the page/dialog you are on.
Almost every page has a Help Icon. When Clicked on the Help Icon will open the context sensitive help in this manual to the page/dialog you are on.
Info Icon
![]() The Info Icon can be found in many lists and will open a new browser window, DeviceInfo Popup,similar to the sidebar in IntraVUE showing information and graphs about the device on that line.
The Info Icon can be found in many lists and will open a new browser window, DeviceInfo Popup,similar to the sidebar in IntraVUE showing information and graphs about the device on that line.
Edit Device Icon
 The Edit Device Icon can be found in many lists and will open the Device Editor Panel with just the selected device displayed for making easy changes to common IntraVUE attributes such as Name, Description, admin verified, Critical Device state, etc..
Table Columns - Hiding, Moving, Sorting
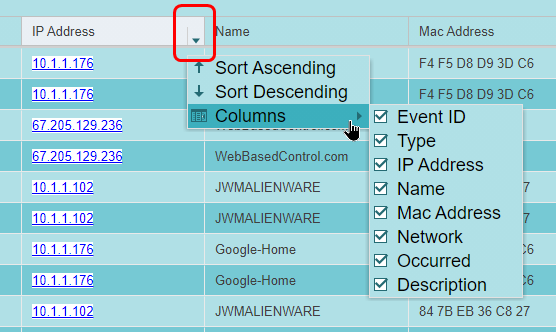
Every column in a table can be sorted by clicking anywhere in the header of the column. Each click reverses the sort.
A down arrow appears on the right side of almost every column in a table. A Columns option will allow the user to show or hide any columns, as shown in the above image.
You may also drag columns, but the default order will be used each time the dialog/panel is started.
Some Grids or Tables in WBC Network Health Monitor have additional Search capabilities that allow you to search on All columns or a Single Column.
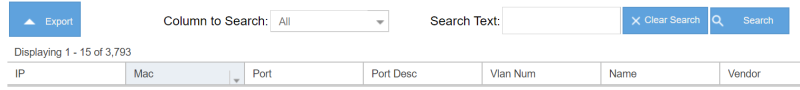
When Sorting is active, green text will indicate the sort is active and above the Grid will be the number of results found.

Exporting Table Data
Most tables have an Export button. Clicking the Export button brings up a dialog to enter the name of the CSV file to save.

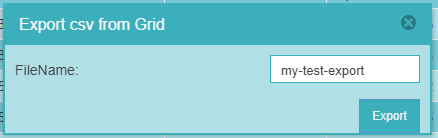
The extension ".csv" is added to the Filename. The download behavior of the browser in use will either save in in the Downloads folder or ask you where to save the file.
Device Links to IntraVUE
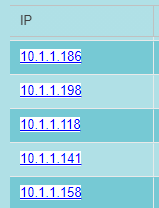 IP Addresses that are underlined and have a white fill are clickable and will open Intravue in a new tab with that device centered and the side panel for the device opened.
NOTE: Any cloacked devices discovered will not have the underline and will not link to Intravue because Intravue is unaware of these devices
Exporting and Printing Graphs
Some graphics in WBC Network Health Monitor allow the graphic to be exported as a SVG (Scalable Vector Graphics) file. This file format allows scaling without distortion to any size.
When you click on the icon, you can save/export the file to a file folder.
Once the file is exported, you will need a third party program in order to print the saved SVG file. One program that was tested is Inkscape. This program was found with a simple Google search and is just one of many that are available. Microsoft PowerPoint and Visio also support SVG files, just drag the file to the application.
Zoom-in and Zoom-out
In certain charts and graphs (maps) you may zoom in using the scroll wheel of the mouse and in others by using the left mouse button to draw a rectangle to zoom into.
To zoom back out if you used the mouse to draw a rectangle, use the right mouse button. If you used the scroll wheel, the wheel zooms in and out.
Exporting Data
All data that is in a table or grid is exportable. Use the Export button and enter a filename, ".csv" will be appended, and you will be able to save the export on your local disk.
The results are saved as a semi-column separated set of data because of the chance a comma could be in the data.
